【PCV】学习笔记(一)
用旧钥匙打开新领域的门
参考2020年8月北京第24次印刷版本
warning: 该书较老且代码不全不太符合规范
其中标题数字代表页码
主要还是记录自己的学习记录,因为总结出自己的学习笔记比翻书节省时间,而且可以锻炼自己的思维能力。
基本的图像操作与处理
PIL
- Python Imaging Library
其中PIL最重要的模块是Image。
1 | from PIL import Image |
其中
pylab和pyplot区别如下:参考博客 :pylab和pyplot的区别
原图:
1 | pil_im = Image.open('logo.JPG') |
转换为灰度图:
1 | pil_gray = pil_im.convert('L') |

复制和粘贴图像区域:
1 | # box大小(左,上,右,下) |
Matplotlib
绘制图像、点和线
1 | # 读取图像到数组中 |
图像的轮廓和直方图
原图:

轮廓图:
1 | from PIL import Image |

直方图:表征像素值分布情况
1 | # 直方图 |

交互式标注
在一幅图像中标注一些点,或者标注一些训练数据。
以下代码为书中代码,但并未实现,如需实现,请使用cv2。
1 | from PIL import Image |
Numpy
图像用数组表示
1 | from PIL import Image |
灰度变换
考虑任意函数 ,也就是一个变换函数。
定义域和值域相同。
1 | im = np.array(Image.open('cat.jpeg').convert('L')) |

1 | # 分为四个小版块,2*2大小 |
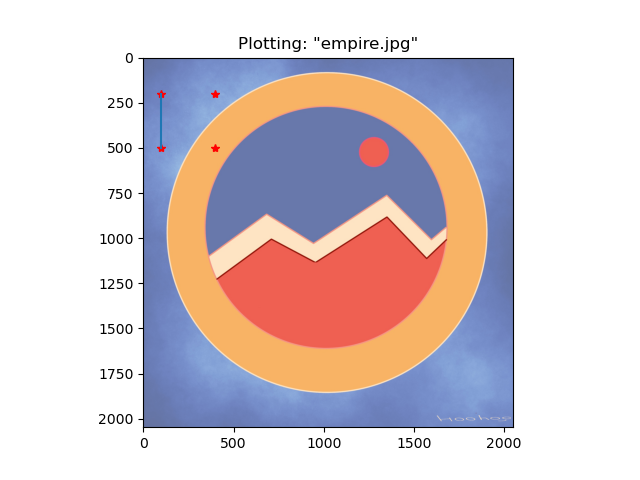
其中有一个问题从今早开始就一直困扰着我,就是我的灰度图是绿色的,如下:

我怀疑我是色盲- -,但是后来取查了一下,发现plt.imshow()默认是三通道的,所以我们需要在imshow()中添加 plt.cm.gray 参数,才显示正确,说真的,现在都用cv2了…

使用
fromarray方法和直接gray的效果很不同:
- 上图为将
array转换为Image后- 下图为使用
plt.cm.gray参数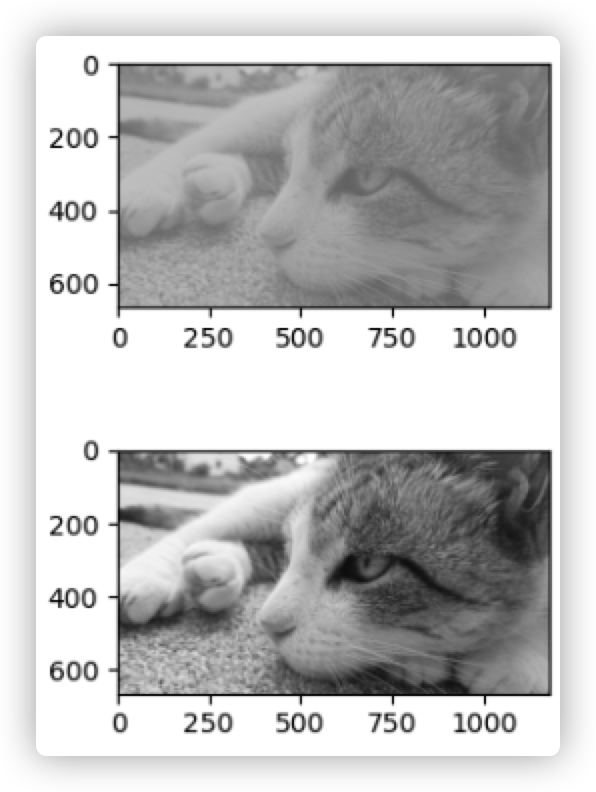
像素范围在[100, 200]内,所以我个人认为可能是上图比较贴合?
【已解决】结论是下图最贴合
经过读书,发现
fromarray方法需要将数据类型转换回来,所以看下图,左图为将其数据类型转换回来后的图,右图为直接转换,并未按照原类型。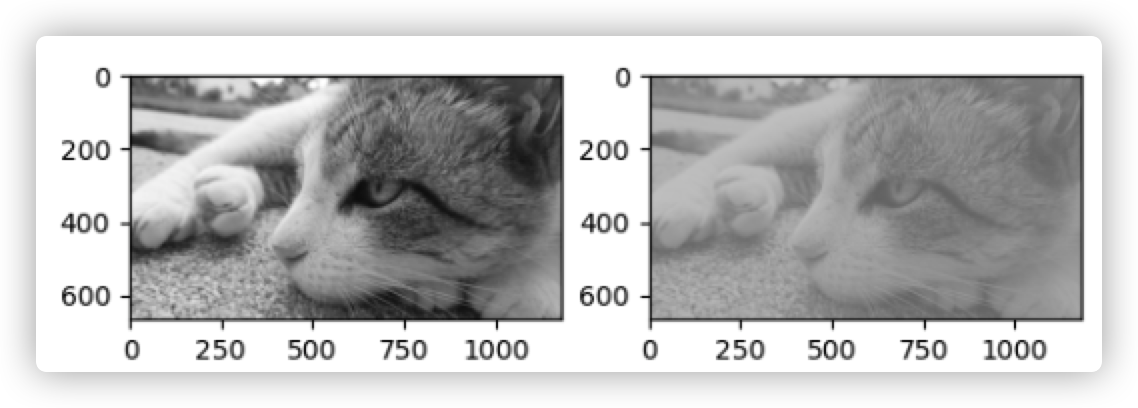
2
3
4
5
6
7
8
9
im6 = Image.fromarray(im3) # 右图直接转换
print(im5)
print(im6)
# 可以看到输出的mode是不同的
>>>
<PIL.Image.Image image mode=L size=1182x665 at 0x7FD867392220>
<PIL.Image.Image image mode=F size=1182x665 at 0x7FD867392AF0>
内置函数将array转换为Image:
1 | pil_im = Image.fromarray(im) |
如果你并不十分确定输入数据的类型,安全起见,应该先转换回来。 注意,NumPy 总是将数组数据类型转换成能够表示数据的“最低”数据类型。对浮点数做乘积或除法操作会使整数类型的数组变成浮点类型。
直方图均衡化
1 | def histeq(im, nbr_bins=256): |
1 | im = np.array(Image.open('cat.jpeg').convert('L')) |
如图所示,上图为原图转换为灰度图,中间图为均衡函数,右图为均衡化后的结果。


----------到结尾啦!! Hoohoo----------